

Bitcoin price today consolidates at $102,674.0 on 6 AM after dropping 7.30% from the all-time high of $110,000. BTC price is down -2.57% after hitting a daily high of $105,575.0. As the prices descend due to short-term volatility, it is important to note key support levels to accumulate as the long-term outlook remains bullish.
Why is Bitcoin Price Crashing Today?
Bitcoin price today is down -2.57% after hitting an all-time high (ATH) of $110,000 just three days ago. On Wednesday, the coin dropped 2.31% and is extending losses in the Asian session. If Bitcoin continues to drop, the key support levels to note include $100,000, $99,134, $98,187 and $96,851. Currently, BTC auctions around $102,674.0.
Explore why the aforementioned levels are important for dip buying and why price forecast for Bitcoin is bullish in the later section of this article.
*bitcoin price updated as of 6 AM.
The year-to-date gain hovers at 10% on January 23 as the value of BTC hovers around $102,674.0. Although many altcoins have easily surpassed Bitcoin’s performance, its outlook remains extremely optimistic due to the first pro-crypto president, the anticipation of a strategic Bitcoin reserve and many institutions following MicroStrategy’s path to accumulate BTC. All of these fundamental developments suggest that there is more room to grow before the bull run hits a new high.
Although Bitcoin is the largest cryptocurrency by market capitalization, its popularity is due to its first-mover advantage and its being a secure, decentralized network. In addition, many narratives, like digital gold, inflation hedges, and uncorrelated assets, have kept BTC at the forefront of the crypto market since its inception in 2009. But will this advantage push Bitcoin’s price to end this month with positive returns?
Can BTC Extend Close January 2025 on a Positive Note?
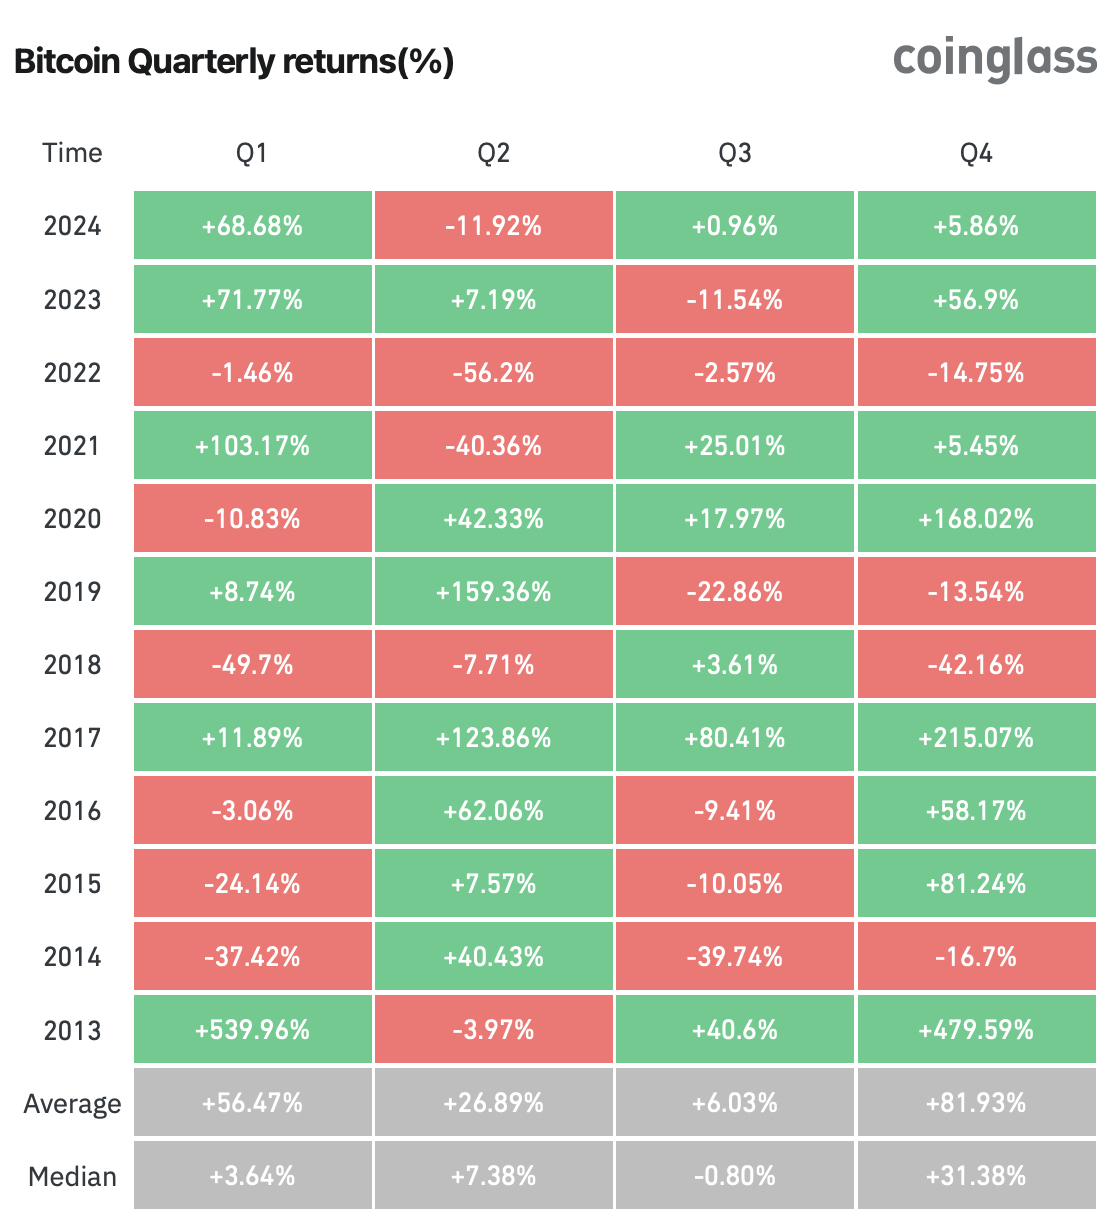
More than a decade’s worth of historical data shows that the first quarter is bullish with an average return of 56%. If history repeats, BTC could close January 2025 on a positive note. As noted above, Bitcoin price is already up 10% in the past 23 days is likely to grow more.
As noted in previous CoinGape publications, the next ATH for Bitcoin could be around $120K. If this target is hit, Bitcoin’s market capitalization, which currently stands at $2,034.8 billion, could reach $2.4 trillion.
Bitcoin’s Market Capitalization
While Bitcoin’s market cap hovers around $2,034.8 billion, with Ethereum, the duo controls nearly 65% of the total cryptocurrency market capitalization. Despite the seven-month consolidation, Bitcoin’s $1.93 trillion market cap remains strong, anticipating it reaching $2 trillion before 2025.
BTC: A composition of 24-hour Trading Volume
Being the top crypto has its benefits; more people tend to flock toward the asset. Likewise, BTC’s 24-hour trading volume stands at $60.5 billion. Binance, one of the largest cryptocurrency exchanges, contributes a major portion of this volume. According to CoinGecko Binance’s share of BTC’s 24-hour trading volume comprises spot and perpetuals trading. While spot volume hovers around 11%, perpetual volume is 41%. Exchanges like OKX, Bitget, etc, follow Binance.
Key Bitcoin Upgrades
With a market cap of $1.93 trillion, it is necessary for the network to remain secure, decentralized, and scalable. This is possible by upgrading the Bitcoin network regularly.
Here are some notable upgrades the Bitcoin network has received or planned to receive since its inception in 2009.
Bitcoin Network Upgrades Since 2009
Here are some key milestone upgrades to the Bitcoin network over the past decade.
2020-2024:
- Taproot Upgrade (2021): Improved Bitcoin’s smart contract functionality, allowing for more complex transactions and enhanced privacy.Muir Glacier Upgrade (2020): Delayed the “ice age” that would have slowed down the network, ensuring the continued smooth operation of Bitcoin.
2017-2019:
- Segregated Witness (SegWit) Upgrade (2017): Increased the block size limit, allowing for more transactions to be processed on the network, and improved the overall scalability of Bitcoin.
- Schnorr/Tapscript Upgrade (proposed): Aims to further improve the efficiency and scalability of Bitcoin transactions, but has not yet been activated.
- SegWit2x (canceled): A proposed upgrade that aimed to increase the block size limit, but was ultimately canceled due to lack of consensus.
2015-2016:
- Bitcoin Core 0.12.0 Upgrade (2016): Introduced several improvements, including better wallet management and enhanced security features.
- BIP66 Upgrade (2015): Standardized the way Bitcoin transactions are verified, improving the overall security and reliability of the network.
2013-2014:
- Bitcoin Core 0.9.0 Upgrade (2014): Introduced a new wallet format and improved the overall performance of the Bitcoin client.
- BIP0016 Upgrade (2013): Enabled the use of payment protocol, allowing for more efficient and secure transactions.
2010-2012:
- Pay-to-Script-Hash (P2SH) Upgrade (2012): Introduced a new type of transaction that allows for more complex payment scenarios, improving the overall flexibility of the Bitcoin network.
- Bitcoin Core 0.6.0 Upgrade (2011): Introduced several improvements, including better wallet management and enhanced security features.
2009-2010:
- Bitcoin Core 0.3.0 Upgrade (2009): One of the earliest upgrades to the Bitcoin network, introducing several key features and improvements.
Bitcoin Price Outlook Between 2025 & 2029
| January | $99,649.12 | $125,255.70 | $114,126.87 |
83.6% |
| February | $99,051.20 | $122,637.45 | $114,193.24 |
83.7% |
| March | $98,453.28 | $120,019.21 | $114,259.62 |
83.8% |
| April | $97,855.36 | $117,400.96 | $114,325.99 |
83.9% |
| May | $97,257.44 | $114,782.72 | $114,392.37 |
84% |
| June | $96,659.52 | $112,164.47 | $114,458.75 |
84.1% |
| July | $96,061.60 | $109,546.23 | $114,525.12 |
84.2% |
| August | $95,463.68 | $106,927.98 | $114,591.50 |
84.3% |
| September | $94,865.76 | $104,309.74 | $114,657.87 |
84.4% |
| October | $94,267.84 | $101,691.49 | $114,724.25 |
84.5% |
| November | $93,669.92 | $99,073.25 | $114,790.62 |
84.6% |
| December | $93,072 | $96,455 | $114,857 |
84.7% |
| All Time | $96,360.56 | $110,855.35 | $114,491.93 |
84.2% |
| January | $96,479.08 | $99,982.08 | $118,907.58 |
91.3% |
| February | $99,886.17 | $103,509.17 | $122,958.17 |
97.8% |
| March | $103,293.25 | $107,036.25 | $127,008.75 |
104.3% |
| April | $106,700.33 | $110,563.33 | $131,059.33 |
110.8% |
| May | $110,107.42 | $114,090.42 | $135,109.92 |
117.3% |
| June | $113,514.50 | $117,617.50 | $139,160.50 |
123.8% |
| July | $116,921.58 | $121,144.58 | $143,211.08 |
130.3% |
| August | $120,328.67 | $124,671.67 | $147,261.67 |
136.9% |
| September | $123,735.75 | $128,198.75 | $151,312.25 |
143.4% |
| October | $127,142.83 | $131,725.83 | $155,362.83 |
149.9% |
| November | $130,549.92 | $135,252.92 | $159,413.42 |
156.4% |
| December | $133,957 | $138,780 | $163,464 |
162.9% |
| All Time | $115,218.04 | $119,381.04 | $141,185.79 |
127.1% |
| January | $139,801.17 | $144,684.75 | $169,276.92 |
172.3% |
| February | $145,645.33 | $150,589.50 | $175,089.83 |
181.6% |
| March | $151,489.50 | $156,494.25 | $180,902.75 |
191% |
| April | $157,333.67 | $162,399 | $186,715.67 |
200.3% |
| May | $163,177.83 | $168,303.75 | $192,528.58 |
209.7% |
| June | $169,022 | $174,208.50 | $198,341.50 |
219% |
| July | $174,866.17 | $180,113.25 | $204,154.42 |
228.4% |
| August | $180,710.33 | $186,018 | $209,967.33 |
237.7% |
| September | $186,554.50 | $191,922.75 | $215,780.25 |
247.1% |
| October | $192,398.67 | $197,827.50 | $221,593.17 |
256.4% |
| November | $198,242.83 | $203,732.25 | $227,406.08 |
265.8% |
| December | $204,087 | $209,637 | $233,219 |
275.1% |
| All Time | $171,944.08 | $177,160.88 | $201,247.96 |
223.7% |
| January | $212,511.67 | $218,298 | $243,655 |
291.9% |
| February | $220,936.33 | $226,959 | $254,091 |
308.7% |
| March | $229,361 | $235,620 | $264,527 |
325.5% |
| April | $237,785.67 | $244,281 | $274,963 |
342.3% |
| May | $246,210.33 | $252,942 | $285,399 |
359% |
| June | $254,635 | $261,603 | $295,835 |
375.8% |
| July | $263,059.67 | $270,264 | $306,271 |
392.6% |
| August | $271,484.33 | $278,925 | $316,707 |
409.4% |
| September | $279,909 | $287,586 | $327,143 |
426.2% |
| October | $288,333.67 | $296,247 | $337,579 |
443% |
| November | $296,758.33 | $304,908 | $348,015 |
459.8% |
| December | $305,183 | $313,569 | $358,451 |
476.5% |
| All Time | $258,847.33 | $265,933.50 | $301,053 |
384.2% |
| January | $317,150.58 | $326,144.33 | $372,391.92 |
499% |
| February | $329,118.17 | $338,719.67 | $386,332.83 |
521.4% |
| March | $341,085.75 | $351,295 | $400,273.75 |
543.8% |
| April | $353,053.33 | $363,870.33 | $414,214.67 |
566.2% |
| May | $365,020.92 | $376,445.67 | $428,155.58 |
588.7% |
| June | $376,988.50 | $389,021 | $442,096.50 |
611.1% |
| July | $388,956.08 | $401,596.33 | $456,037.42 |
633.5% |
| August | $400,923.67 | $414,171.67 | $469,978.33 |
655.9% |
| September | $412,891.25 | $426,747 | $483,919.25 |
678.4% |
| October | $424,858.83 | $439,322.33 | $497,860.17 |
700.8% |
| November | $436,826.42 | $451,897.67 | $511,801.08 |
723.2% |
| December | $448,794 | $464,473 | $525,742 |
745.6% |
| All Time | $382,972.29 | $395,308.67 | $449,066.96 |
622.3% |
In the next year, aka 2025, Bitcoin price is likely to stay well above the six-digit territory and shows no signs of correction below it. Coingape’s Bitcoin price prediction data reveals a peak of $104,280.26 in February 2025.
Bitcoin Price Outlook Between 2030 and 2050
2030
2031
2032
2033
2040
2050
| January | $465,154.42 | $481,462.17 | $546,469.67 |
779% |
| February | $481,514.83 | $498,451.33 | $567,197.33 |
812.3% |
| March | $497,875.25 | $515,440.50 | $587,925 |
845.6% |
| April | $514,235.67 | $532,429.67 | $608,652.67 |
879% |
| May | $530,596.08 | $549,418.83 | $629,380.33 |
912.3% |
| June | $546,956.50 | $566,408 | $650,108 |
945.7% |
| July | $563,316.92 | $583,397.17 | $670,835.67 |
979% |
| August | $579,677.33 | $600,386.33 | $691,563.33 |
1012.3% |
| September | $596,037.75 | $617,375.50 | $712,291 |
1045.7% |
| October | $612,398.17 | $634,364.67 | $733,018.67 |
1079% |
| November | $628,758.58 | $651,353.83 | $753,746.33 |
1112.4% |
| December | $645,119 | $668,343 | $774,474 |
1145.7% |
| All Time | $555,136.71 | $574,902.58 | $660,471.83 |
962.3% |
| January | $667,167.08 | $691,240.58 | $802,526.58 |
1190.8% |
| February | $689,215.17 | $714,138.17 | $830,579.17 |
1235.9% |
| March | $711,263.25 | $737,035.75 | $858,631.75 |
1281.1% |
| April | $733,311.33 | $759,933.33 | $886,684.33 |
1326.2% |
| May | $755,359.42 | $782,830.92 | $914,736.92 |
1371.3% |
| June | $777,407.50 | $805,728.50 | $942,789.50 |
1416.4% |
| July | $799,455.58 | $828,626.08 | $970,842.08 |
1461.5% |
| August | $821,503.67 | $851,523.67 | $998,894.67 |
1506.7% |
| September | $843,551.75 | $874,421.25 | $1,026,947.25 |
1551.8% |
| October | $865,599.83 | $897,318.83 | $1,054,999.83 |
1596.9% |
| November | $887,647.92 | $920,216.42 | $1,083,052.42 |
1642% |
| December | $909,696 | $943,114 | $1,111,105 |
1687.1% |
| All Time | $788,431.54 | $817,177.29 | $956,815.79 |
1439% |
| January | $946,061.92 | $979,838.83 | $1,150,786.08 |
1751% |
| February | $982,427.83 | $1,016,563.67 | $1,190,467.17 |
1814.8% |
| March | $1,018,793.75 | $1,053,288.50 | $1,230,148.25 |
1878.6% |
| April | $1,055,159.67 | $1,090,013.33 | $1,269,829.33 |
1942.4% |
| May | $1,091,525.58 | $1,126,738.17 | $1,309,510.42 |
2006.3% |
| June | $1,127,891.50 | $1,163,463 | $1,349,191.50 |
2070.1% |
| July | $1,164,257.42 | $1,200,187.83 | $1,388,872.58 |
2133.9% |
| August | $1,200,623.33 | $1,236,912.67 | $1,428,553.67 |
2197.7% |
| September | $1,236,989.25 | $1,273,637.50 | $1,468,234.75 |
2261.6% |
| October | $1,273,355.17 | $1,310,362.33 | $1,507,915.83 |
2325.4% |
| November | $1,309,721.08 | $1,347,087.17 | $1,547,596.92 |
2389.2% |
| December | $1,346,087 | $1,383,812 | $1,587,278 |
2453% |
| All Time | $1,146,074.46 | $1,181,825.42 | $1,369,032.04 |
2102% |
| January | $1,387,378.67 | $1,426,572.58 | $1,647,465.92 |
2549.9% |
| February | $1,428,670.33 | $1,469,333.17 | $1,707,653.83 |
2646.7% |
| March | $1,469,962 | $1,512,093.75 | $1,767,841.75 |
2743.5% |
| April | $1,511,253.67 | $1,554,854.33 | $1,828,029.67 |
2840.3% |
| May | $1,552,545.33 | $1,597,614.92 | $1,888,217.58 |
2937.1% |
| June | $1,593,837 | $1,640,375.50 | $1,948,405.50 |
3033.9% |
| July | $1,635,128.67 | $1,683,136.08 | $2,008,593.42 |
3130.7% |
| August | $1,676,420.33 | $1,725,896.67 | $2,068,781.33 |
3227.5% |
| September | $1,717,712 | $1,768,657.25 | $2,128,969.25 |
3324.3% |
| October | $1,759,003.67 | $1,811,417.83 | $2,189,157.17 |
3421.1% |
| November | $1,800,295.33 | $1,854,178.42 | $2,249,345.08 |
3517.9% |
| December | $1,841,587 | $1,896,939 | $2,309,533 |
3614.7% |
| All Time | $1,614,482.83 | $1,661,755.79 | $1,978,499.46 |
3082.3% |
| January | $1,912,592.58 | $1,975,978.17 | $2,362,093.25 |
3699.3% |
| February | $1,983,598.17 | $2,055,017.33 | $2,414,653.50 |
3783.8% |
| March | $2,054,603.75 | $2,134,056.50 | $2,467,213.75 |
3868.4% |
| April | $2,125,609.33 | $2,213,095.67 | $2,519,774 |
3952.9% |
| May | $2,196,614.92 | $2,292,134.83 | $2,572,334.25 |
4037.4% |
| June | $2,267,620.50 | $2,371,174 | $2,624,894.50 |
4122% |
| July | $2,338,626.08 | $2,450,213.17 | $2,677,454.75 |
4206.5% |
| August | $2,409,631.67 | $2,529,252.33 | $2,730,015 |
4291.1% |
| September | $2,480,637.25 | $2,608,291.50 | $2,782,575.25 |
4375.6% |
| October | $2,551,642.83 | $2,687,330.67 | $2,835,135.50 |
4460.1% |
| November | $2,622,648.42 | $2,766,369.83 | $2,887,695.75 |
4544.7% |
| December | $2,693,654 | $2,845,409 | $2,940,256 |
4629.2% |
| All Time | $2,303,123.29 | $2,410,693.58 | $2,651,174.63 |
4164.3% |
| January | $2,753,723.75 | $2,916,544.25 | $3,019,295.17 |
4756.4% |
| February | $2,813,793.50 | $2,987,679.50 | $3,098,334.33 |
4883.5% |
| March | $2,873,863.25 | $3,058,814.75 | $3,177,373.50 |
5010.6% |
| April | $2,933,933 | $3,129,950 | $3,256,412.67 |
5137.7% |
| May | $2,994,002.75 | $3,201,085.25 | $3,335,451.83 |
5264.9% |
| June | $3,054,072.50 | $3,272,220.50 | $3,414,491 |
5392% |
| July | $3,114,142.25 | $3,343,355.75 | $3,493,530.17 |
5519.1% |
| August | $3,174,212 | $3,414,491 | $3,572,569.33 |
5646.3% |
| September | $3,234,281.75 | $3,485,626.25 | $3,651,608.50 |
5773.4% |
| October | $3,294,351.50 | $3,556,761.50 | $3,730,647.67 |
5900.5% |
| November | $3,354,421.25 | $3,627,896.75 | $3,809,686.83 |
6027.7% |
| December | $3,414,491 | $3,699,032 | $3,888,726 |
6154.8% |
| All Time | $3,084,107.38 | $3,307,788.13 | $3,454,010.58 |
5455.6% |
Roughly five years from now, aka 2030, Bitcoin’s price will see an explosion to the upside, with an all-time high of $774,474 in the aforementioned year. In the same period, BTC could reach a low of $465,154.42. Based on CoinGape predictions, the average price of BTC in 2050 is between $2.9 million and $3.3 million.
Investors should note that these long-term predictions can change and, hence, should be taken with a grain of salt.
Bitcoin Price Forecast: Why BTC is Crashing and What to Expect Next?
The three-month volume profile that extends from November 14, 2024. shows a range extending from $100K to $92.3K. Since BTC trades around $102,674.0 after dropping -2.57% today, the next key support level is $100K. This is a psychological level, hence investors looking to buy the dips will be paying close attention to it.
The second support area is the previous weekly and monthly VWAPs at $99,132 and $98,187, respectively. These levels serve as a key area of demand.
According to the volume profile indicator, the highest volume was tarded at $96,851 and is called a point of control.
So, a drop into these pivotal Bitcoin price levels will most likely be a good opportunity to accumulate BTC before another uptrend leg kickstart.

Since Bitcoin’s outlook remains strong from a technical perspective and its fundamentals are as strong as ever due to the pro-crypto president, investors can expect the next leg of the bull run to start after a dip into any of these key levels.


